Most athletes run one test, look at one number, and move on. The issue is simple: isolated data does not build speed.
Sprint Insights solves that by answering one question every week: Am I improving?
If you are new to the platform, start your account here: Create a Free SpeedTrackr Account.
What Sprint Insights Actually Does
Sprint Insights aggregates results from your core sprint tools:
- Photo Finish for sprint split timing
- Reaction Timer for start speed
- Jump Measure for explosive output
- Sprint Form Analysis for mechanics and cadence quality
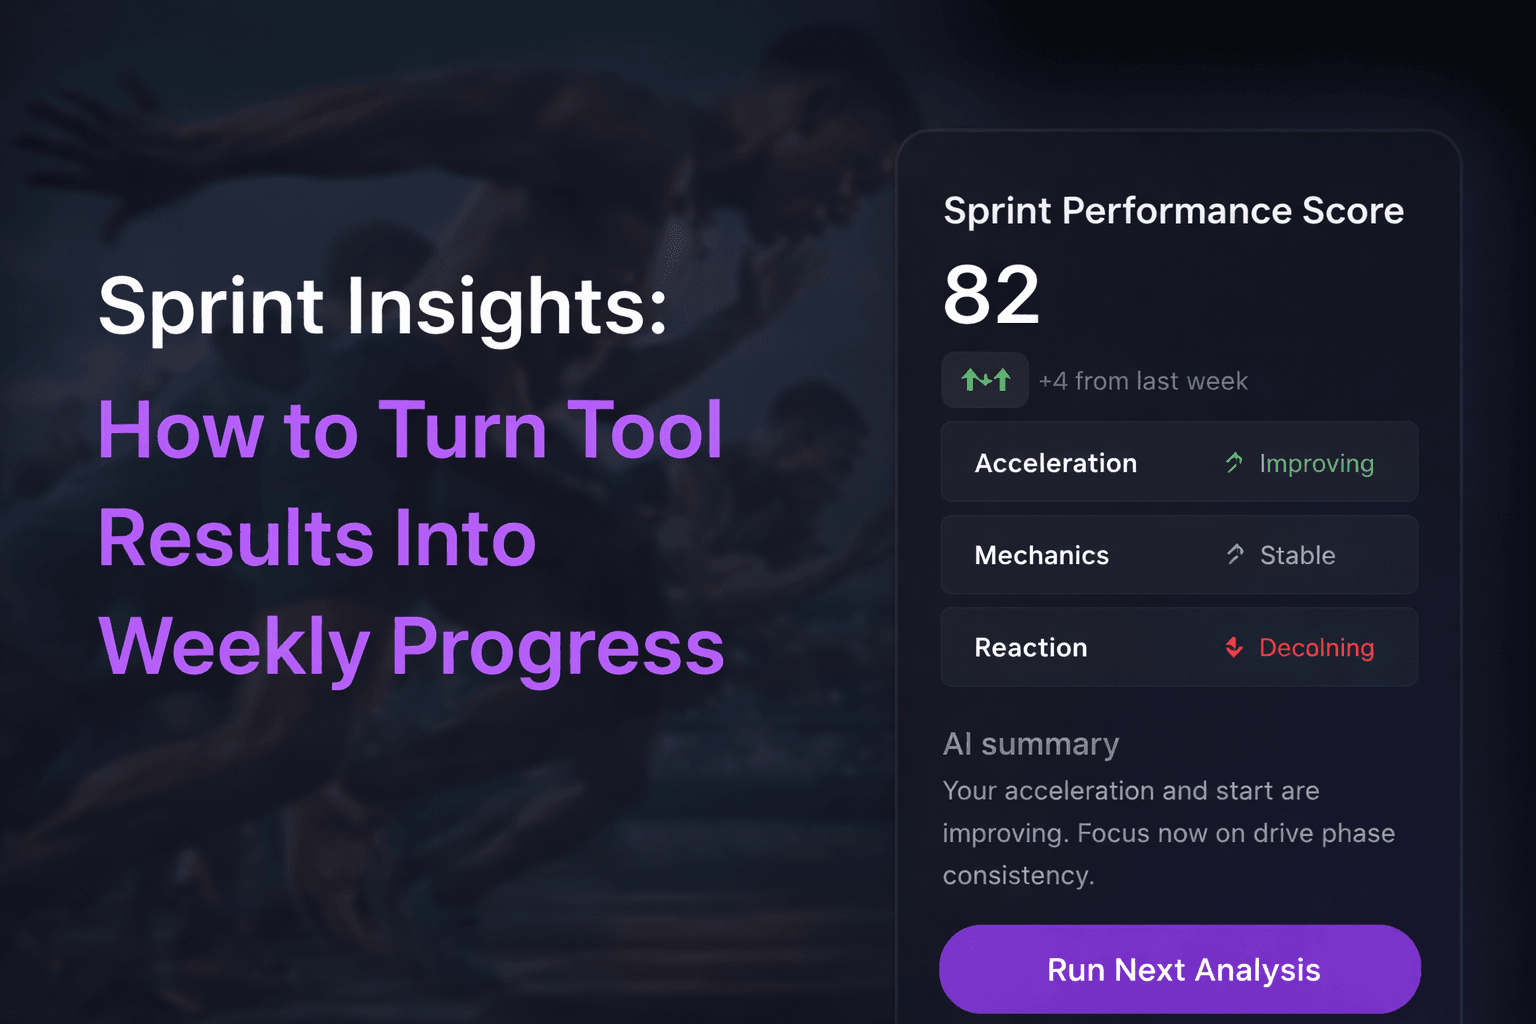
Instead of seeing random session numbers, you get:
- A unified performance score
- Trend context (improving, stable, or declining)
- A clear next action for your next test
The Weekly Loop That Improves Speed
Use this simple 7-day loop:
- Run two short tool sessions (for example Photo Finish + Reaction Timer)
- Save both results to Sprint Insights
- Review trend text and score movement
- Add one corrective session (drills, starts, or power work)
- Re-test the same tools after 5-7 days
Consistency matters more than running every tool daily.
Metric Priorities by Role
Different athletes should emphasize different metrics:
- Acceleration-focused sprinters: prioritize split time and reaction
- Max velocity athletes: prioritize mechanics quality and cadence consistency
- Field/court athletes: prioritize jump output and reaction under fatigue
You can still track all metrics, but your improvement target should match your event demands.
When to Use the AI Summary (1 Credit)
Use the AI summary when:
- Your score is flat for 2-3 sessions
- One metric improves while another declines
- You need training priorities for the next microcycle
The AI summary is most valuable when enough recent tool data exists to generate useful context.
Common Mistake: Retesting Different Conditions
Avoid comparing sessions when your test setup changes too much.
Keep these consistent:
- Same camera angle and position
- Similar warm-up structure
- Similar surface and shoes
- Similar fatigue state
Better test consistency means better trend reliability.
A Practical 3-Session Example
- Session A: Photo Finish + Reaction Timer
- Session B: Sprint Form Analysis
- Session C: Jump Measure + Photo Finish re-test
This gives enough coverage to move the score with meaningful signal, not noise.
Final Takeaway
Sprint Insights is not another dashboard. It is a retention-friendly training layer that tells athletes what changed and what to do next.
Run your first data loop now:
Put it into practice.
Turn this insight into numbers — time your sprints, measure your jumps, and track your reaction time with SpeedTrackr for Android.
Free 4-week sprint plan.
Join the weekly sprint newsletter and get a research-backed 100m training blueprint — acceleration, max velocity, plyometrics, and speed endurance. Instant download.
Weekly, no spam. Unsubscribe anytime.


